Tesla
across California.
How many Tesla vehicles are in California? At least 895,343, across 1,115 ZIPs. The most are in Fremont 94538, with at least 8,476.
895,343+vehicles
Top 10 California ZIP codes for Tesla
Fremont 94538 has the most registered Tesla vehicles, at least 8,476, among 1,119 ZIP codes with 5,000+ residents and 2,000+ vehicles, fleet ZIPs removed.
California ZIP codes where Tesla has the highest share
Tesla vehicles as a share of all vehicles in each ZIP code. Ranked among 1,119 ZIPs with 5,000+ residents and 2,000+ vehicles, fleet ZIPs removed.
Tesla by California county and city
Each count is a lower bound, because the DMV pools small groups. Share lists leave out fleet ZIPs.
California counties with the most Tesla vehicles
Los Angeles County221,673+3.1% of local vehiclesOrange County118,208+4.6% of local vehiclesSanta Clara County95,686+6.5% of local vehiclesSan Diego County79,613+3.0% of local vehiclesAlameda County62,750+5.3% of local vehiclesAmong the highest Tesla shares, by county
Santa Clara County6.5%+95,443+ of 1,456,365San Mateo County5.6%+31,556+ of 556,040Alameda County5.3%+62,750+ of 1,167,710San Francisco County4.9%+20,710+ of 418,163Orange County4.6%+118,208+ of 2,533,472California cities with the most Tesla vehicles
Los Angeles41,992+2.7% of local vehiclesSan Jose41,959+5.3% of local vehiclesSan Diego37,093+3.6% of local vehiclesIrvine24,008+10.6% of local vehiclesSan Francisco20,724+4.9% of local vehiclesAmong the highest Tesla shares, by city
Playa Vista13.3%+812+ of 6,094Los Altos13.2%+4,907+ of 36,906Newport Coast13.1%+1,262+ of 9,596Saratoga12.8%+3,593+ of 27,911Dublin12.4%+6,185+ of 49,578Zero-emission Tesla vehicles
1,070,990 counted by the state energy agency, a year newer than the DMV file.
Top-selling new Tesla models in California
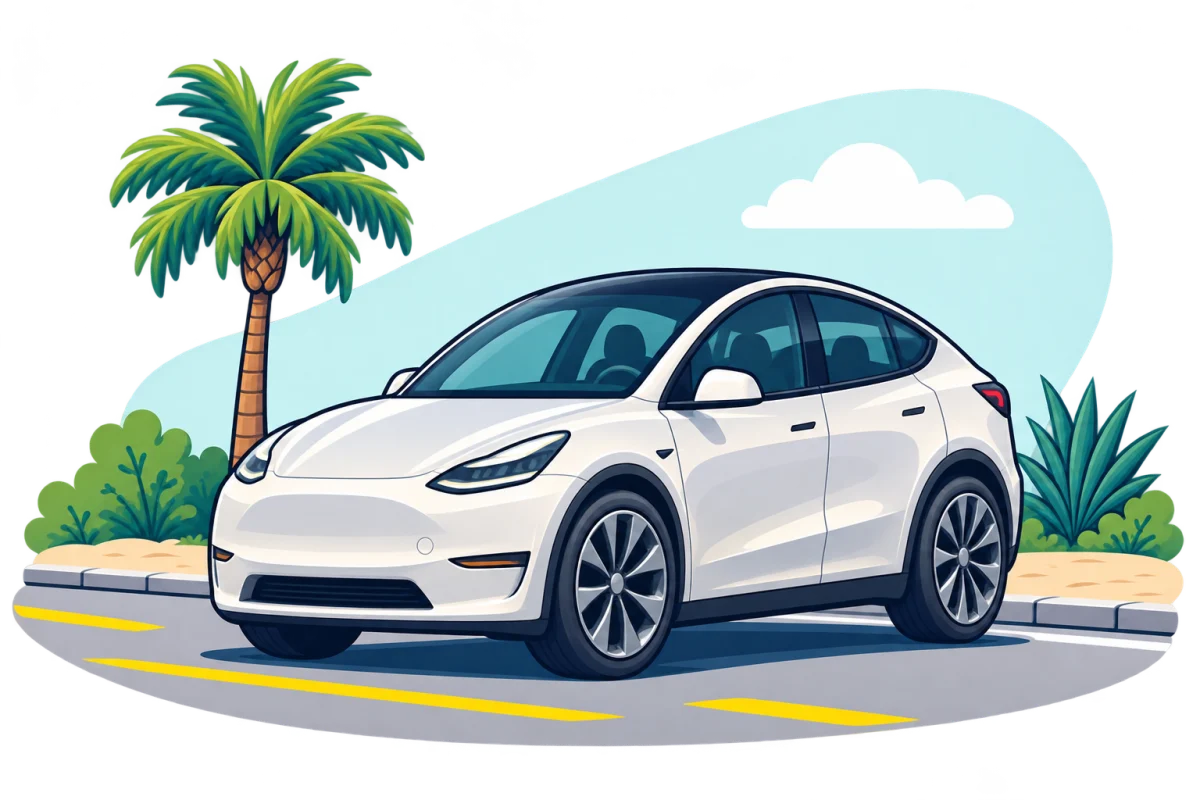
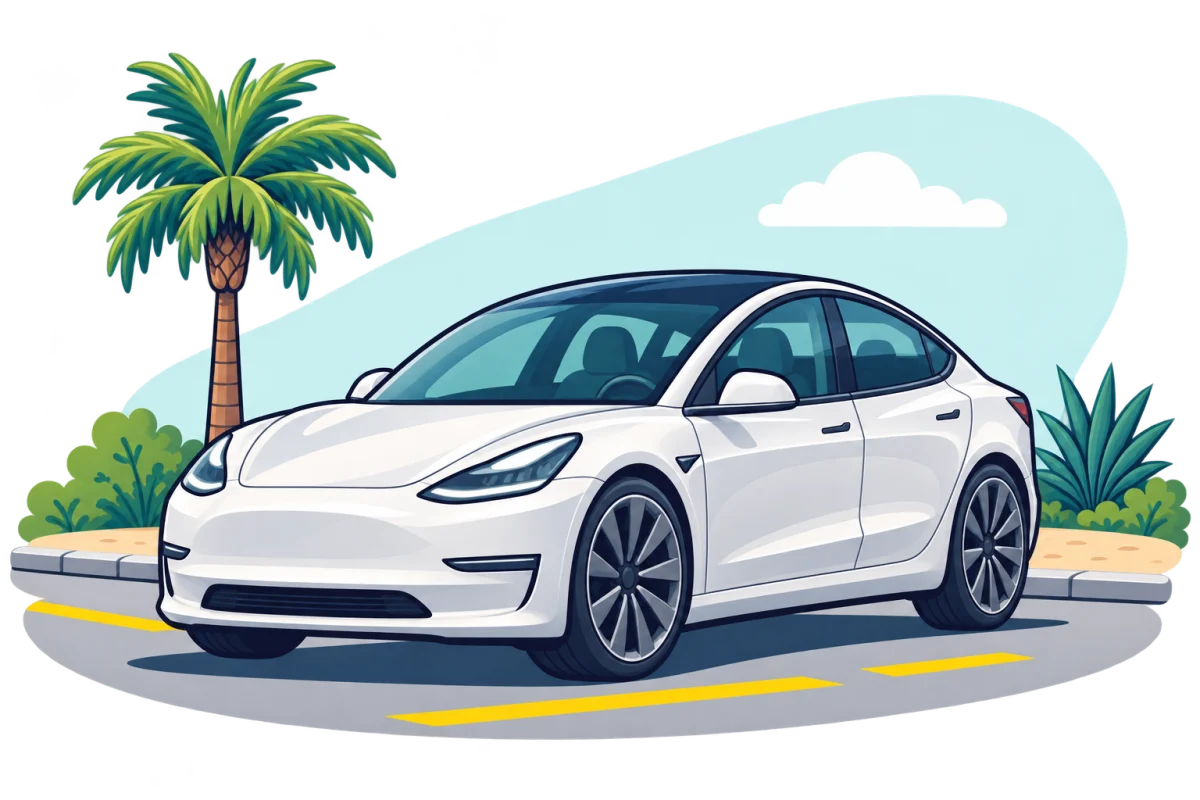
New retail registrations this year, fleets excluded, from the California New Car Dealers Association. Each model is among the top five in its segment. The DMV file has no model names, so these count new cars, not every Tesla on the road. Only plug-in and fuel-cell models have county maps. The state energy agency publishes gas, hybrid and diesel vehicles without a make or model.
Other current Tesla models
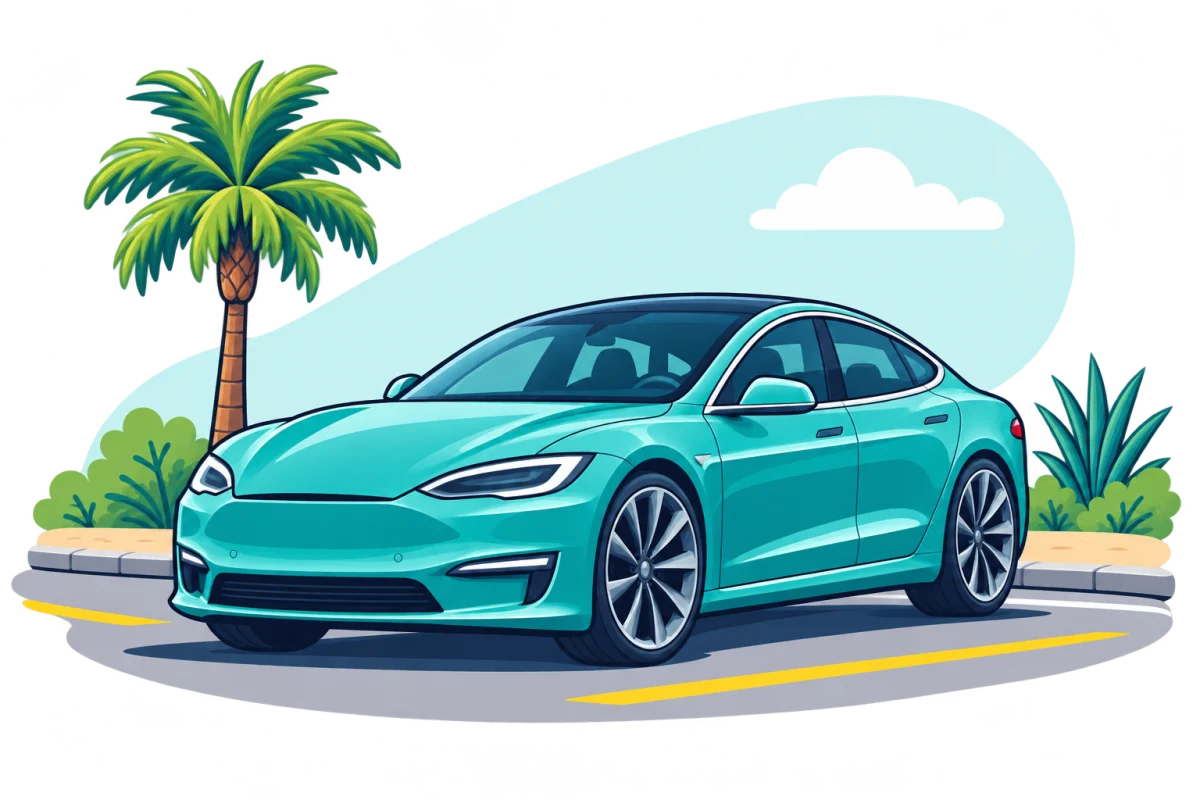
Tesla models from model years 2026 and 2027 in the U.S. EPA fuel economy catalog, one card per model line. The DMV file has no model names, so this shows the lineup, not how many are on California roads.
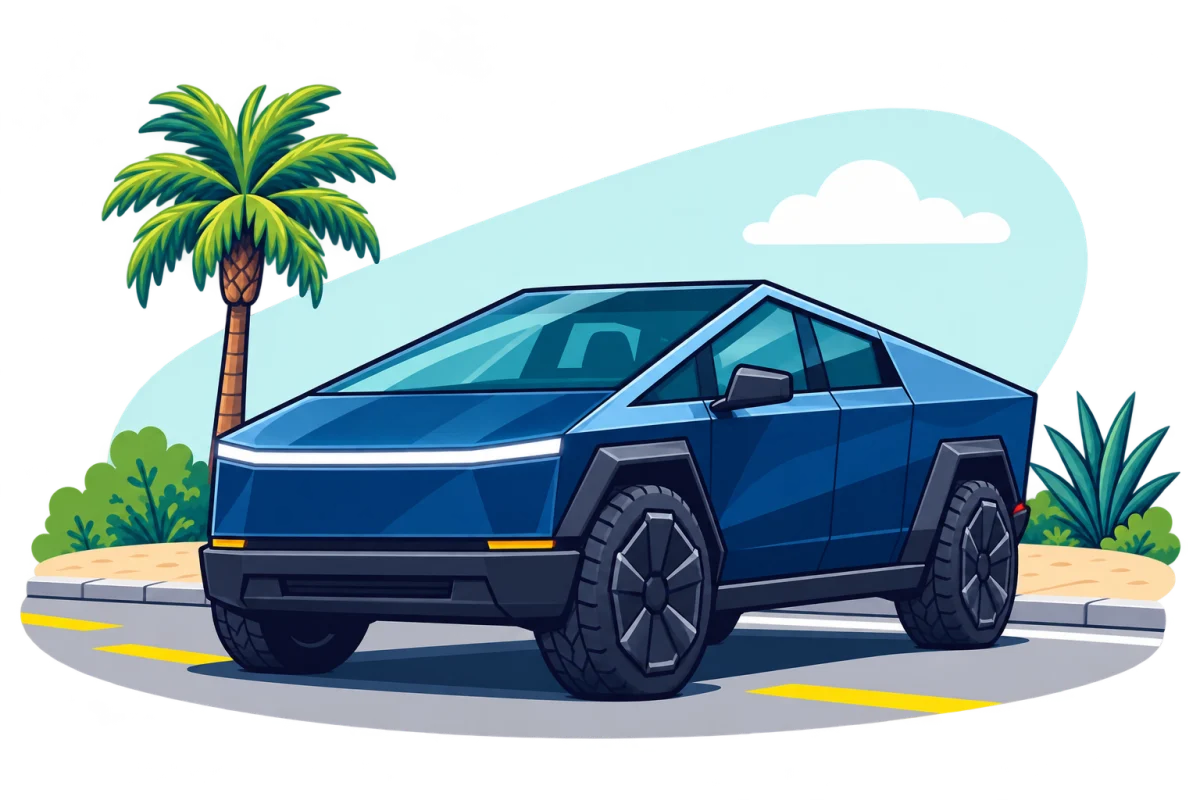 Tesla Cybertruck Pickup Electric
By county: Cybertruck
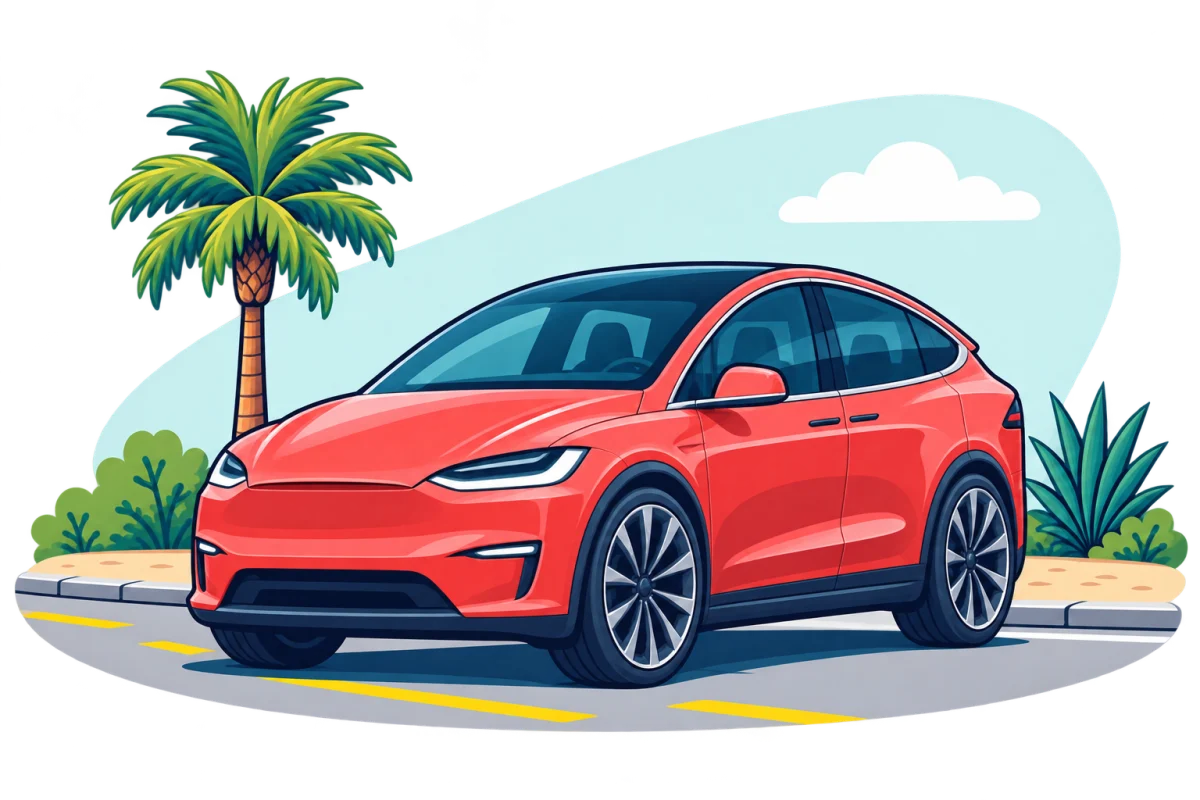 Tesla Model X SUV Electric
By county: Model X
The model-year mix
A closer look at plug-in and fuel-cell models
1,070,990 Tesla plug-in and fuel-cell vehicles across California counties.
New-car registrations
Tesla in California's new light-vehicle market, including fleets.
- Year to date
- 121,822 -10.0% vs 135,293 a year earlier, revised
- Latest quarter
- 43,994 -15.4% year over year
U.S. rated models and configurations
87 models, 187 U.S. rated configurations, 2012–2027. Browse fuel economy, powertrain, range and U.S. specifications.