Toyota
across California.
How many Toyota vehicles are in California? At least 5,735,265, across 1,686 ZIPs. The most are in Westminster 92683, with at least 20,891.
5,735,265+vehicles
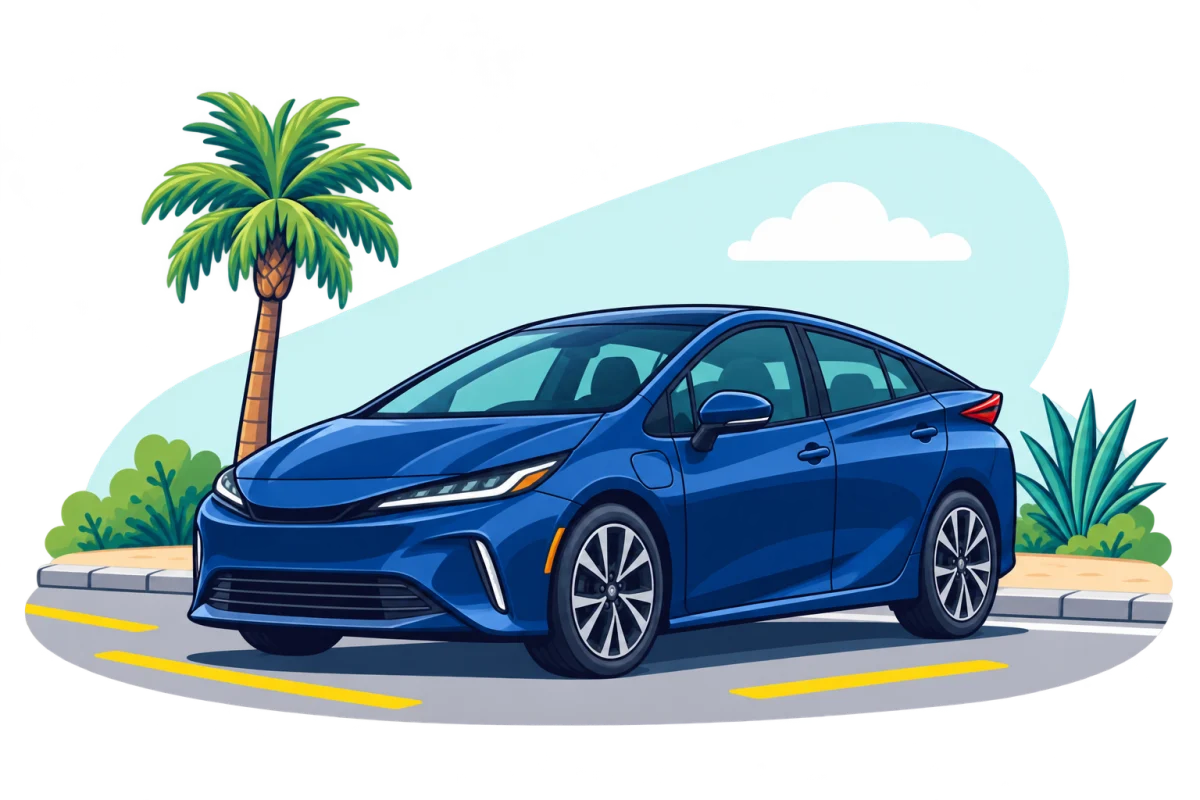
Top 10 California ZIP codes for Toyota
Westminster 92683 has the most registered Toyota vehicles, at least 20,891, among 1,119 ZIP codes with 5,000+ residents and 2,000+ vehicles, fleet ZIPs removed.
California ZIP codes where Toyota has the highest share
Toyota vehicles as a share of all vehicles in each ZIP code. Ranked among 1,119 ZIPs with 5,000+ residents and 2,000+ vehicles, fleet ZIPs removed.
Toyota by California county and city
Each count is a lower bound, because the DMV pools small groups. Share lists leave out fleet ZIPs.
California counties with the most Toyota vehicles
Los Angeles County1,449,124+20.3% of local vehiclesSan Diego County508,590+19.3% of local vehiclesOrange County503,516+19.8% of local vehiclesRiverside County356,550+18.7% of local vehiclesSan Bernardino County317,710+18.8% of local vehiclesAmong the highest Toyota shares, by county
Inyo County22.4%+4,654+ of 20,708San Francisco County22.1%+92,509+ of 418,163Santa Cruz County21.7%+48,178+ of 221,440Alameda County21.3%+249,474+ of 1,167,710Sacramento County20.7%+250,599+ of 1,208,683The fuel mix
DMV count, without electric fuels.
Zero-emission Toyota vehicles
141,587 counted by the state energy agency, a year newer than the DMV file.
Top-selling new Toyota models in California
New retail registrations this year, fleets excluded, from the California New Car Dealers Association. Each model is among the top five in its segment. The DMV file has no model names, so these count new cars, not every Toyota on the road. Only plug-in and fuel-cell models have county maps. The state energy agency publishes gas, hybrid and diesel vehicles without a make or model.
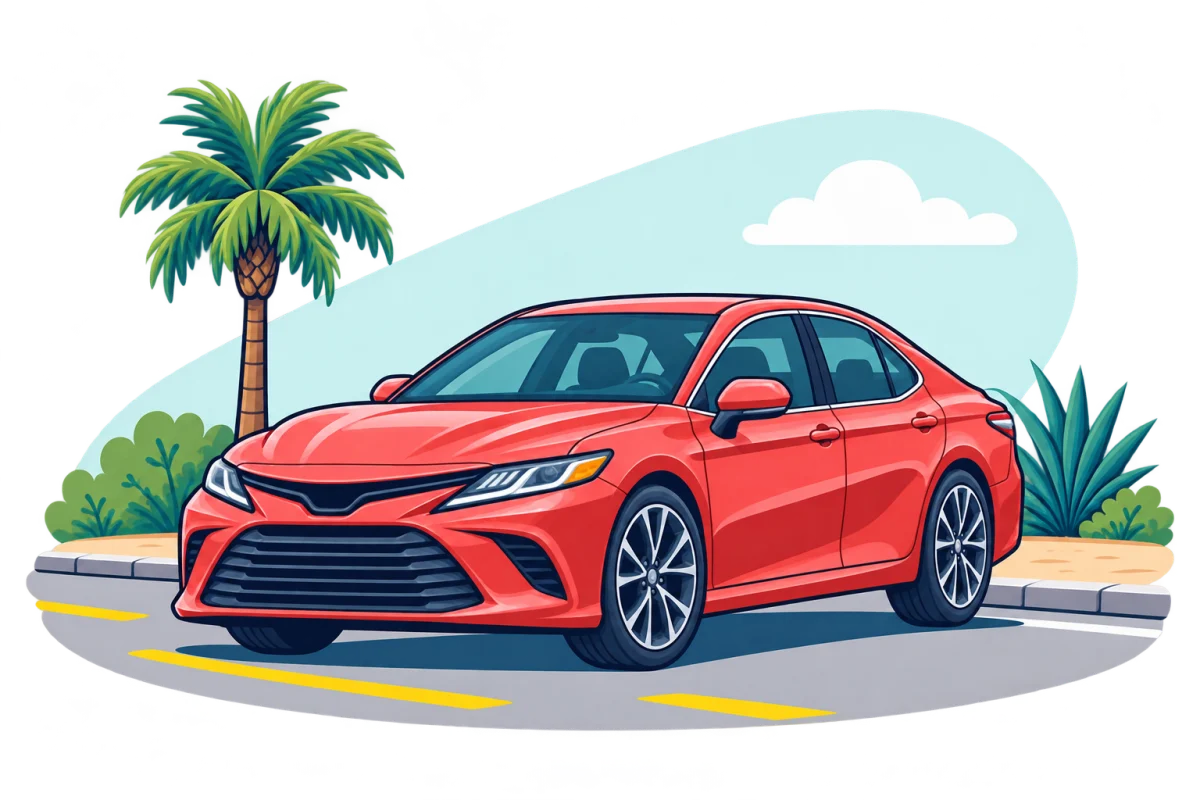 Toyota Camry #1 among mid-size and large cars 52,224 54.8% of segment
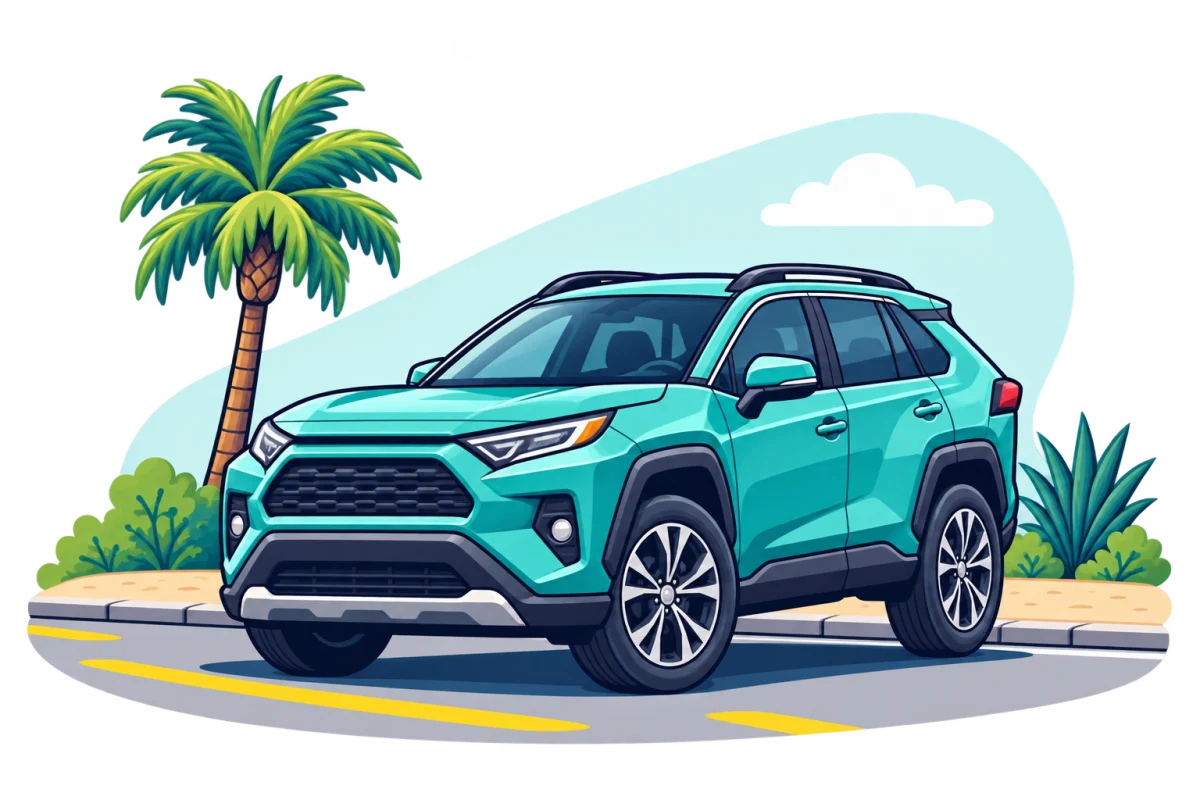 Toyota RAV4 #2 among compact SUVs 37,801 17.5% of segment
By county: RAV4 Prime, RAV4 PHEV, RAV4 EV
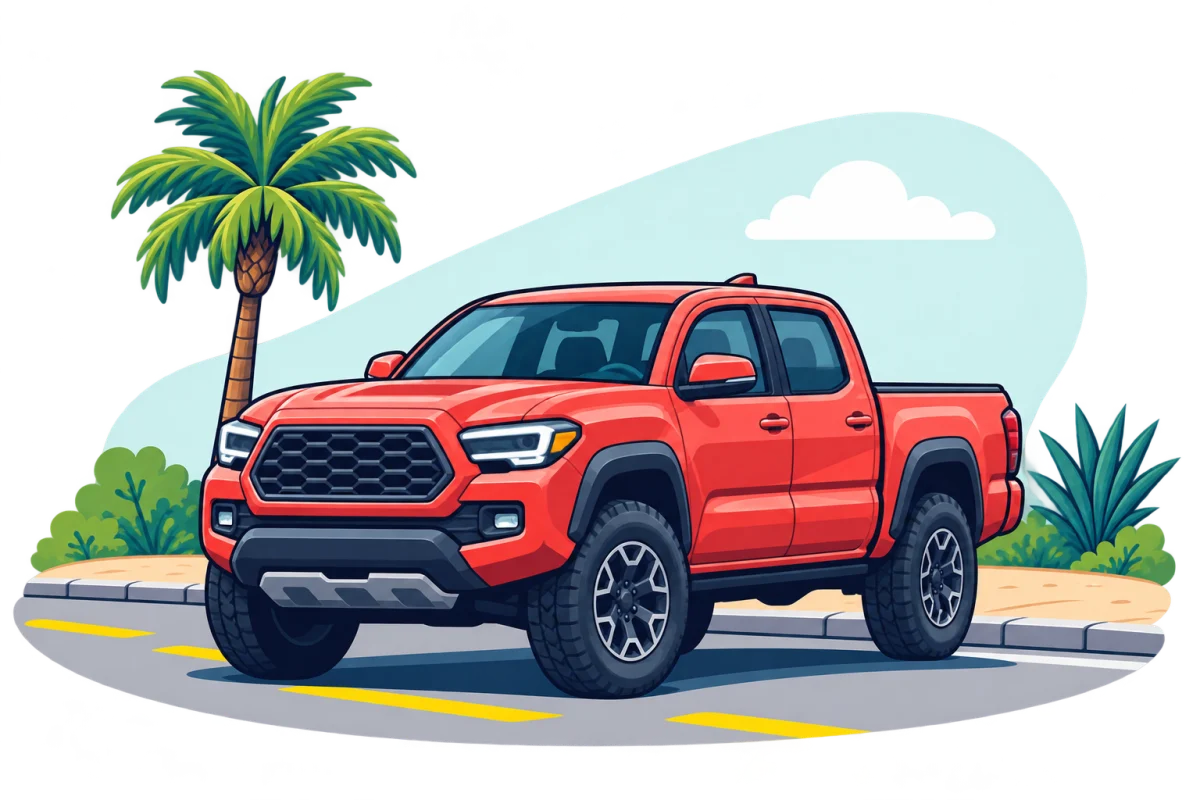 Toyota Tacoma #1 among compact and mid-size pickups 36,330 51.5% of segment
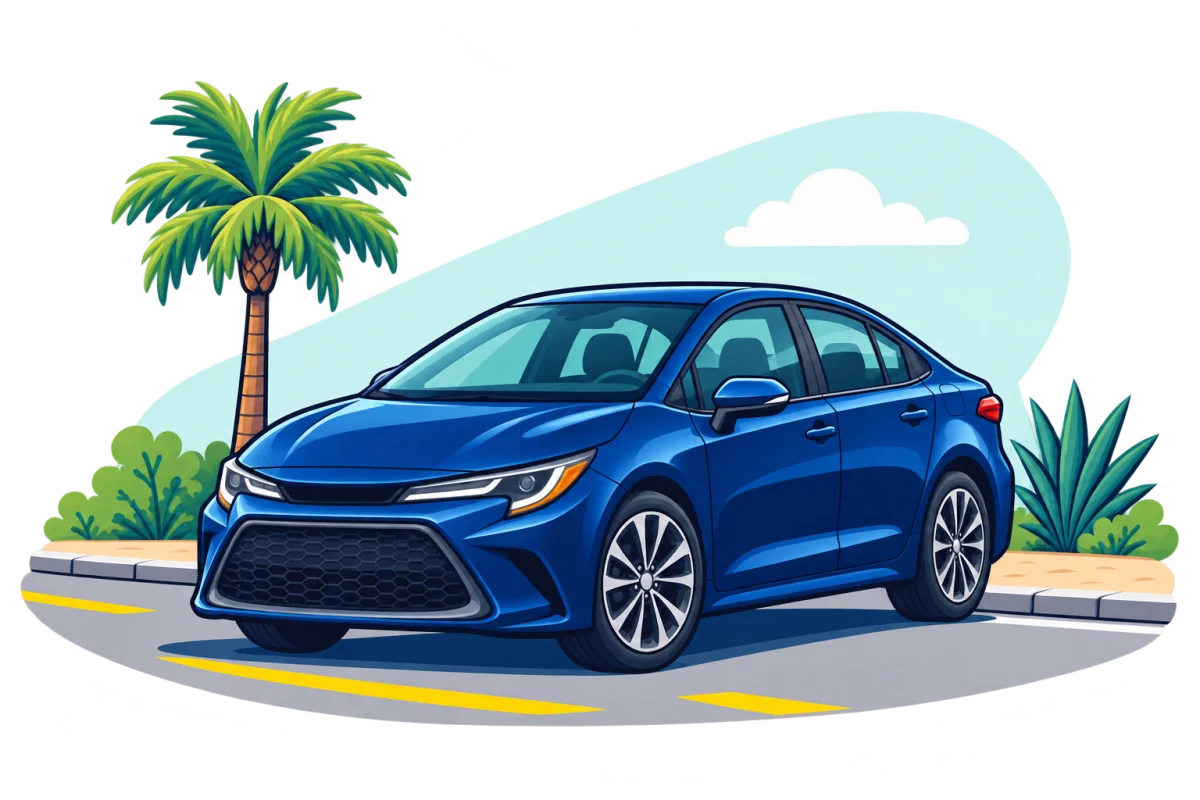 Toyota Corolla #2 among small cars 31,937 24.2% of segment
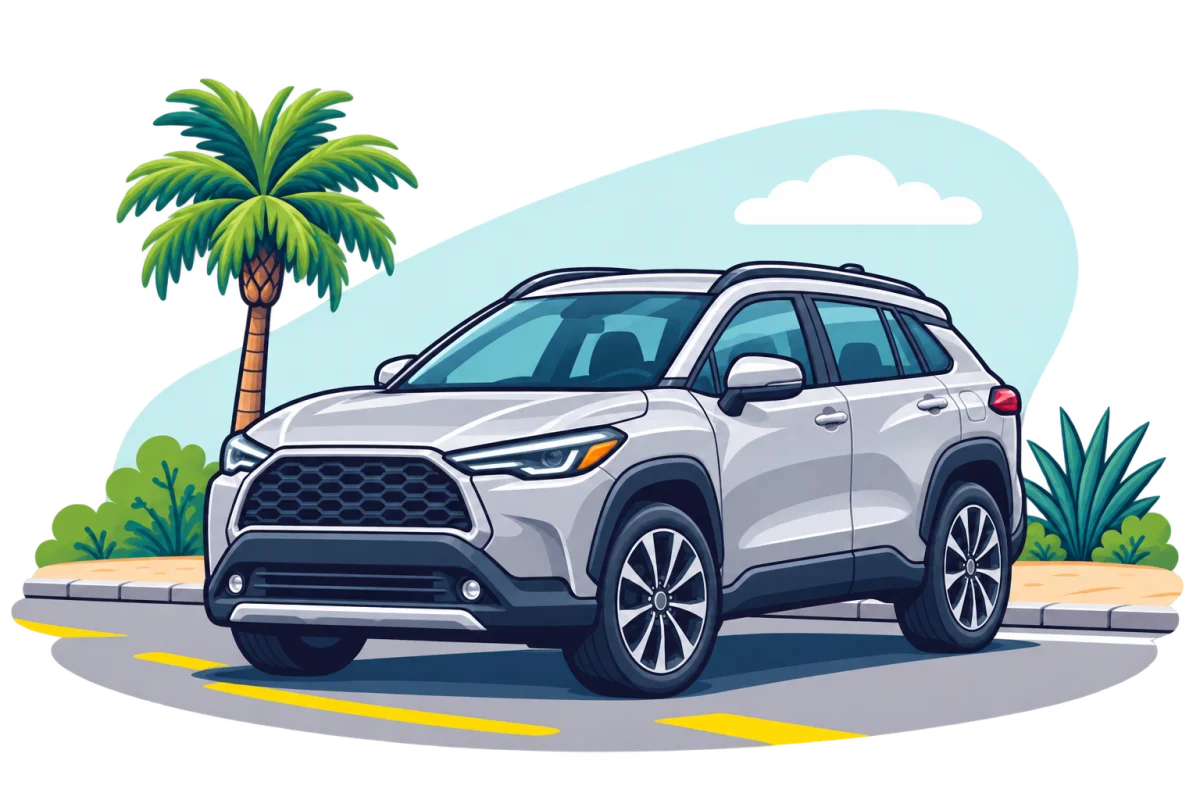 Toyota Corolla Cross #2 among subcompact SUVs 13,076 14.5% of segment
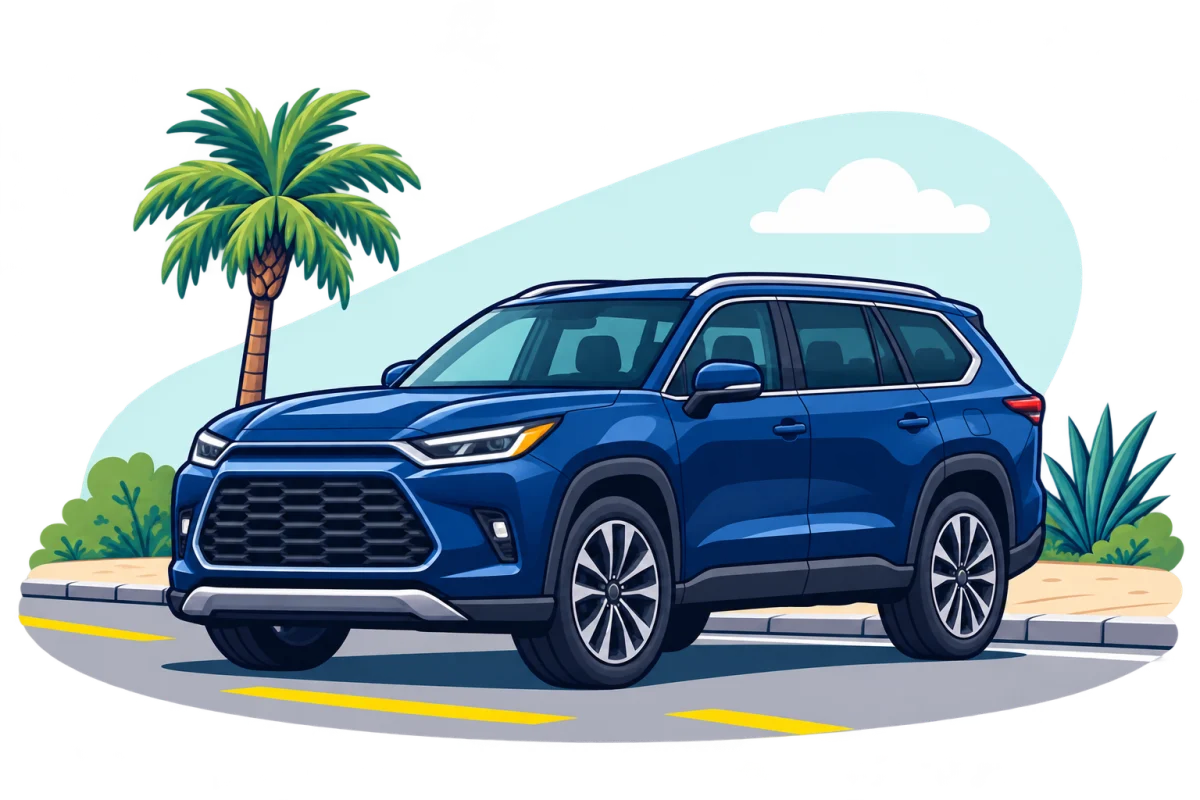 Toyota Grand Highlander #1 among three-row mid-size SUVs 12,837 12.2% of segment
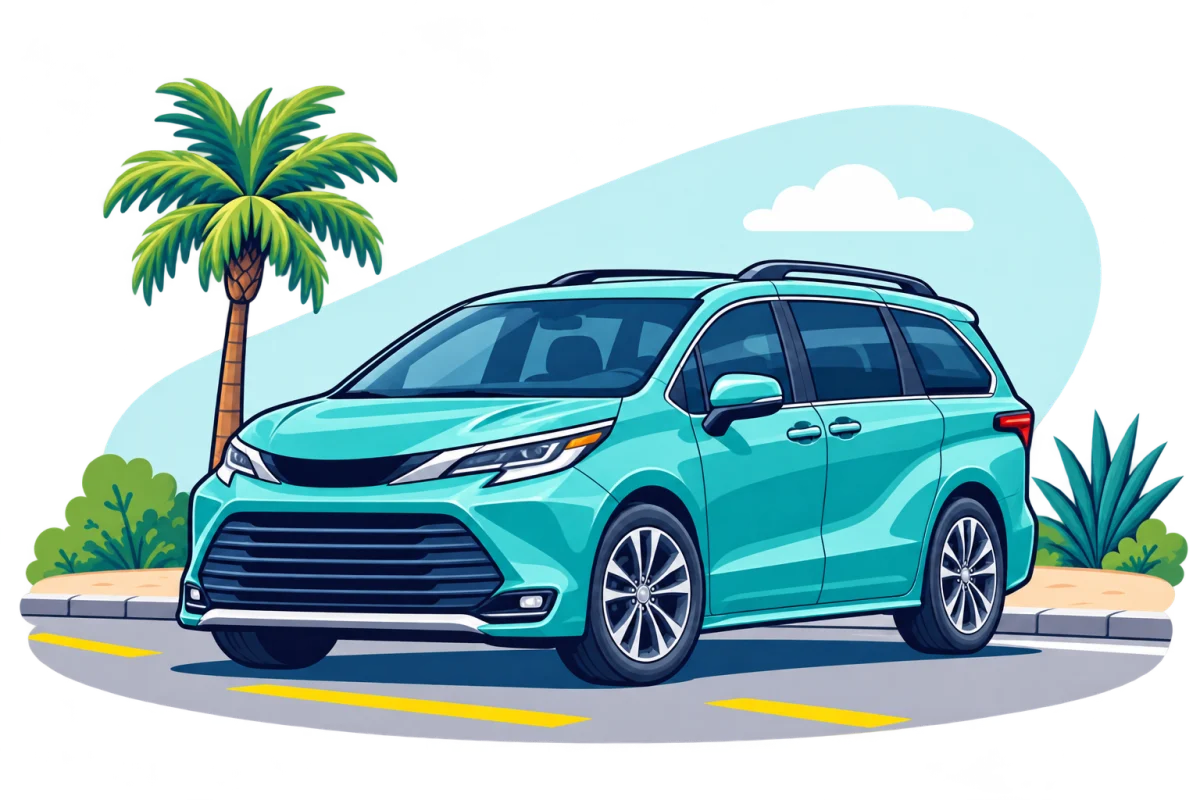 Toyota Sienna #1 among minivans 11,890 40.0% of segment
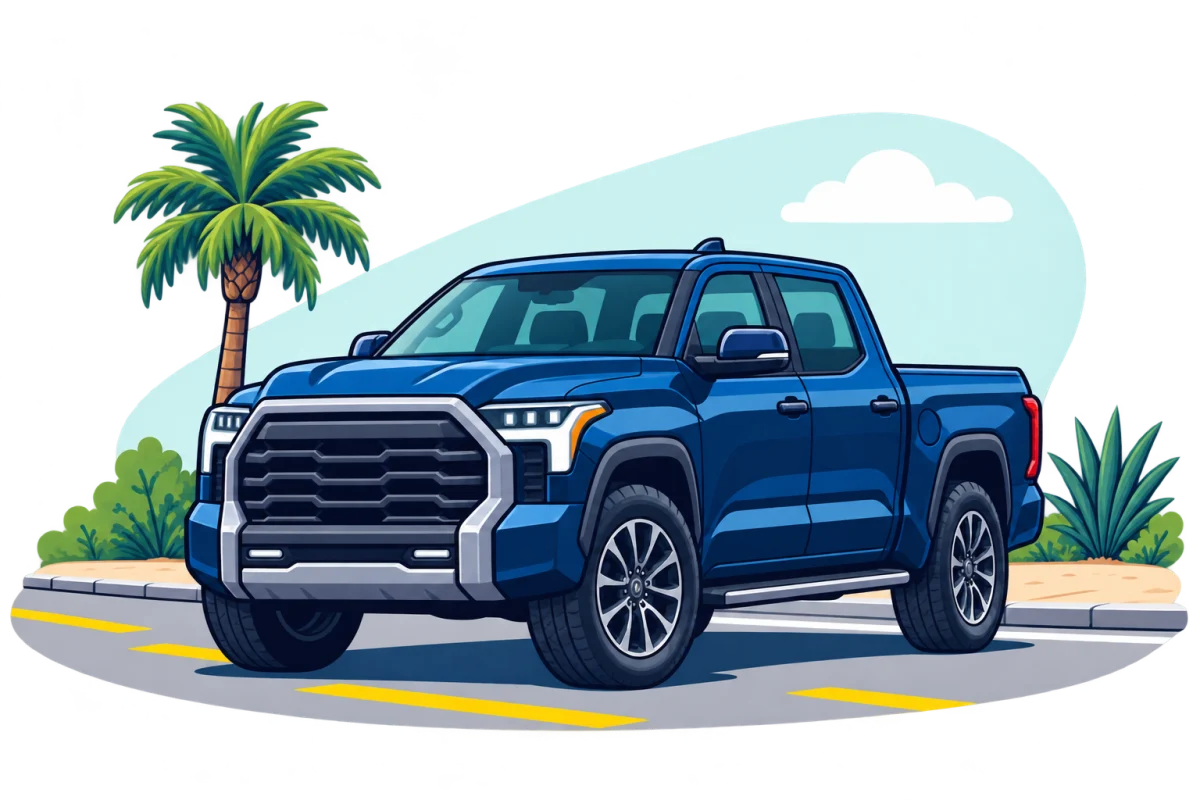 Toyota Tundra #5 among full-size pickups 11,499 11.4% of segment
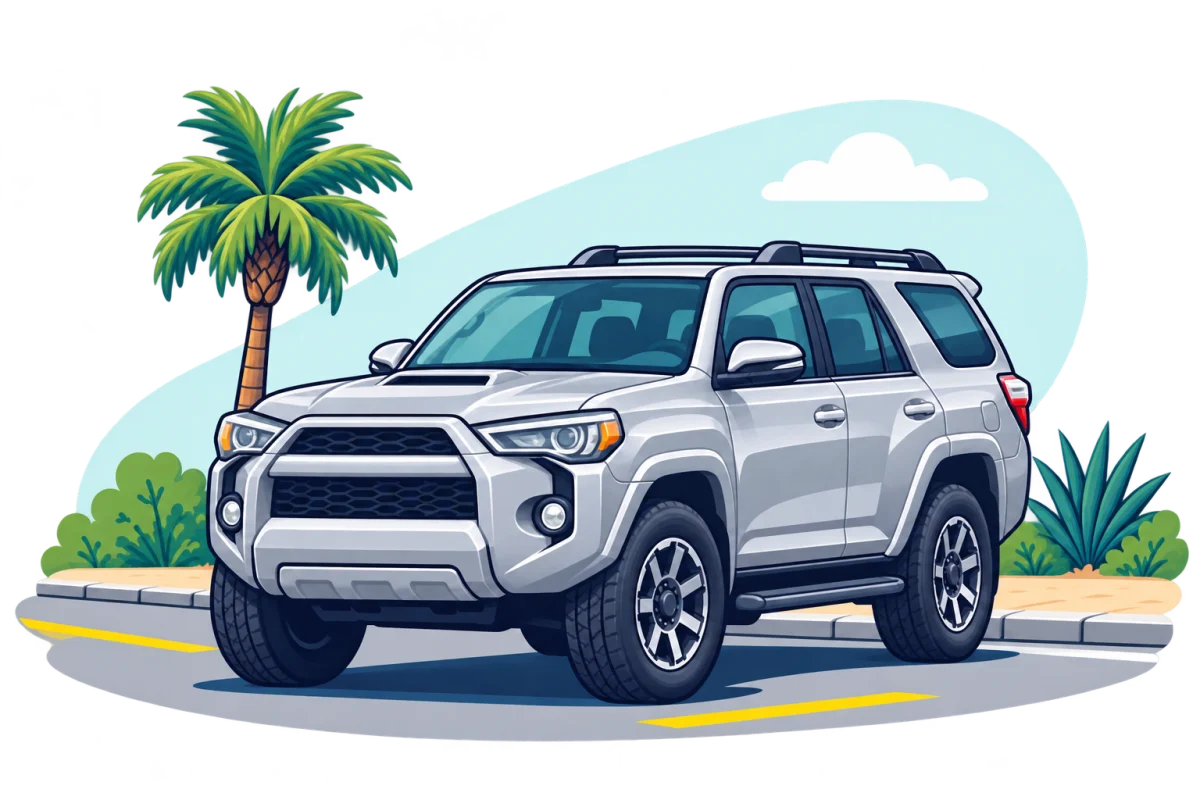 Toyota 4Runner #1 among two-row mid-size SUVs 11,216 24.9% of segment
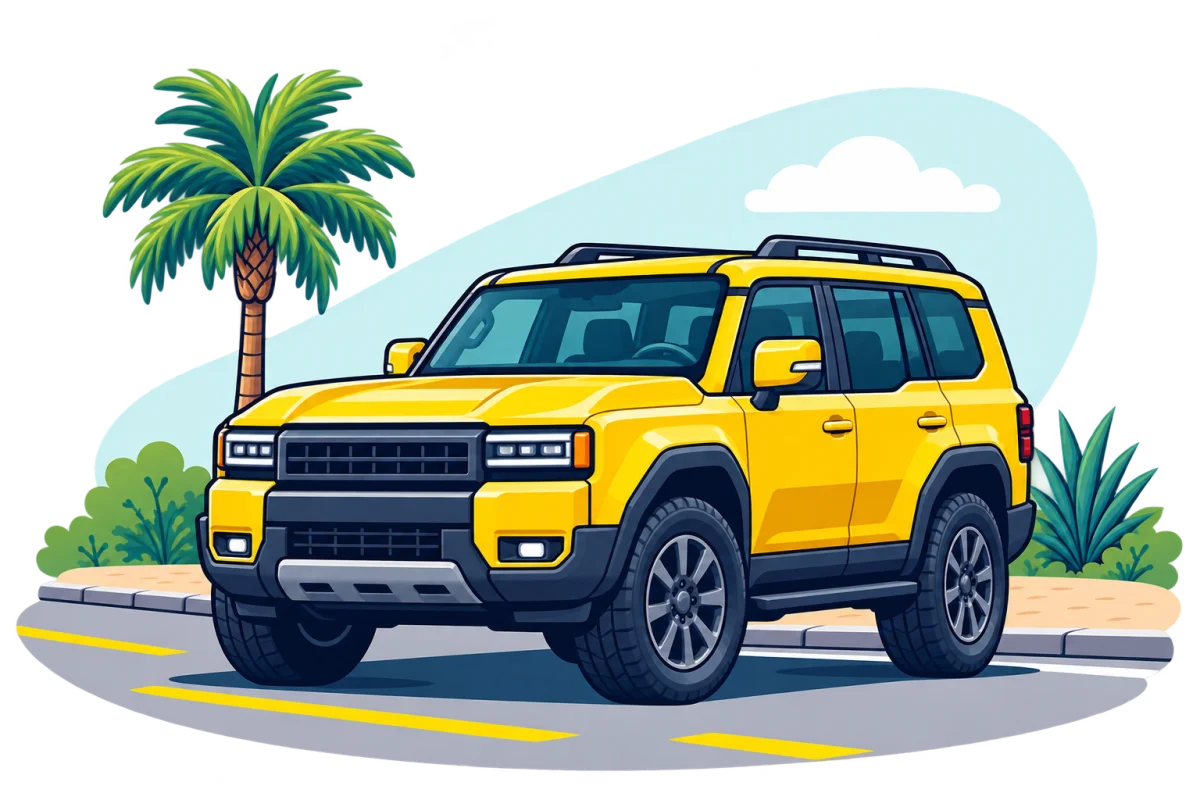 Toyota Land Cruiser #4 among large SUVs 3,591 10.5% of segment
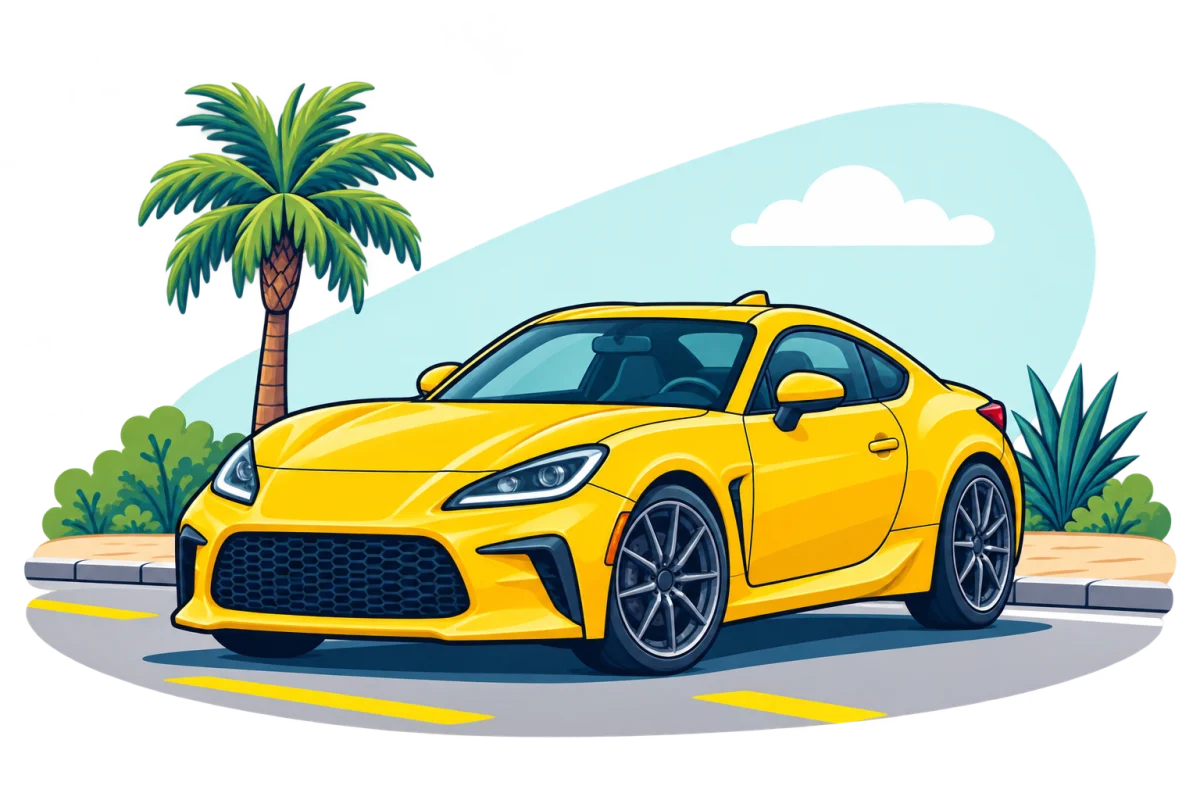 Toyota 86 #2 among sports and pony cars 1,284 14.4% of segment
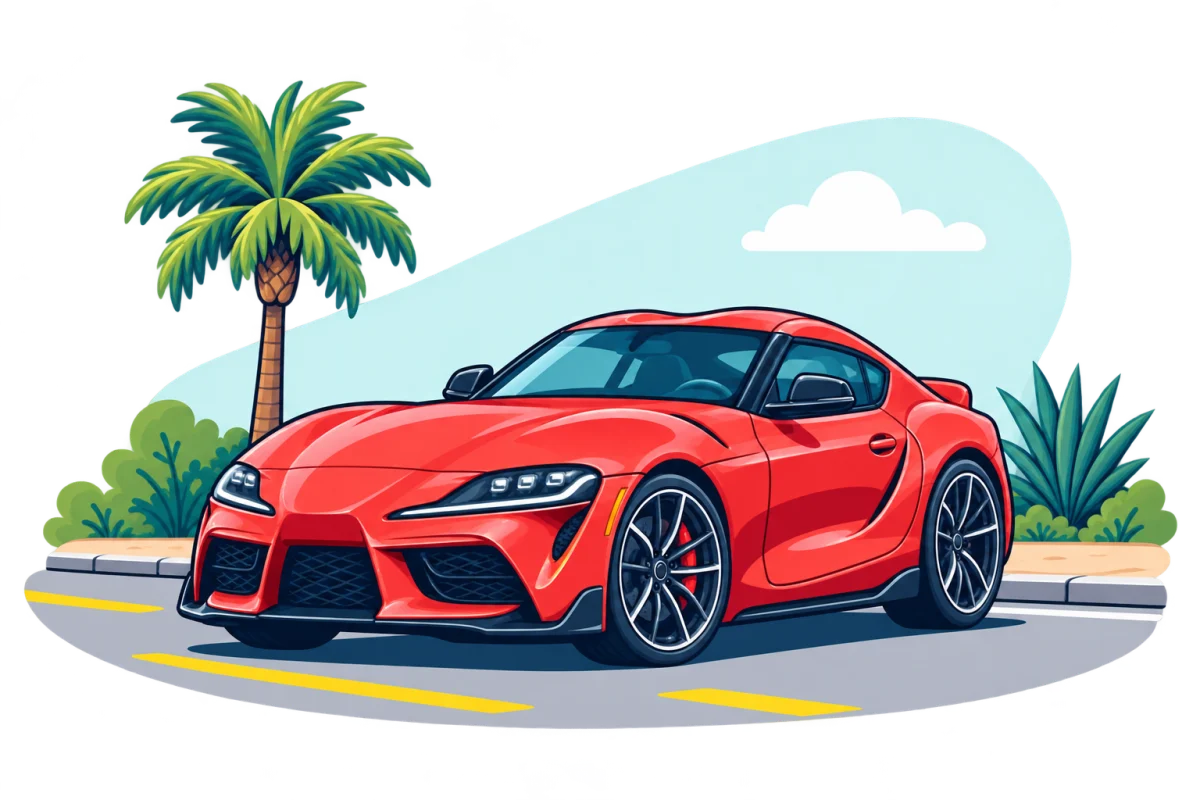 Toyota Supra #5 among sports and pony cars 548 6.1% of segment
Other current Toyota models
Toyota models from model years 2026 and 2027 in the U.S. EPA fuel economy catalog, one card per model line. The DMV file has no model names, so this shows the lineup, not how many are on California roads.
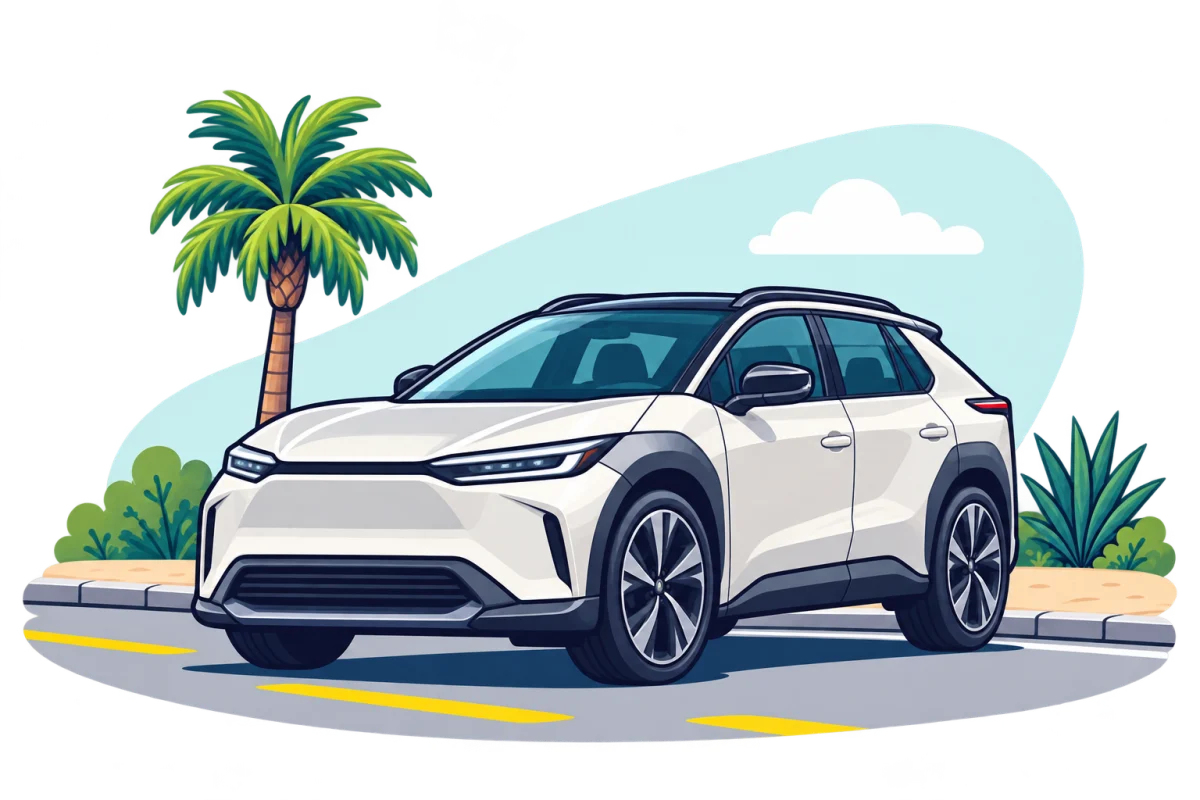 Toyota bZ SUV Electric
By county: bZ
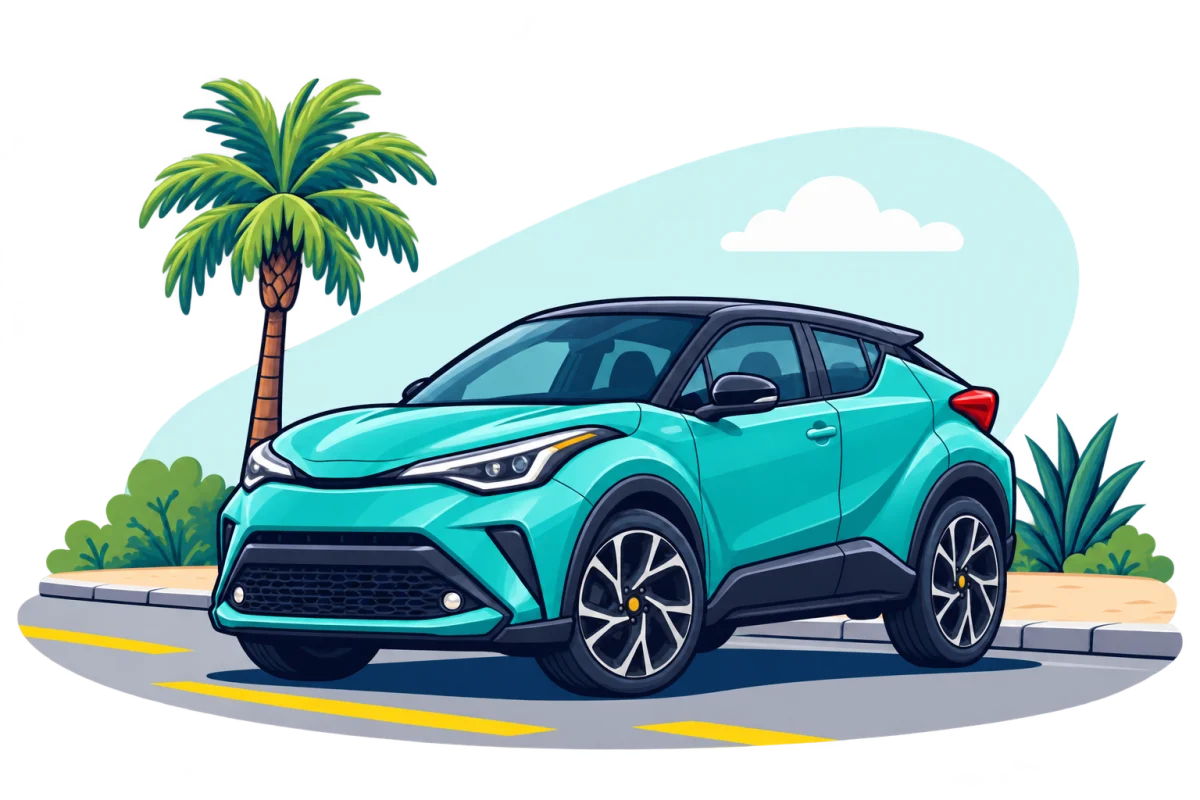 Toyota C-HR SUV Electric
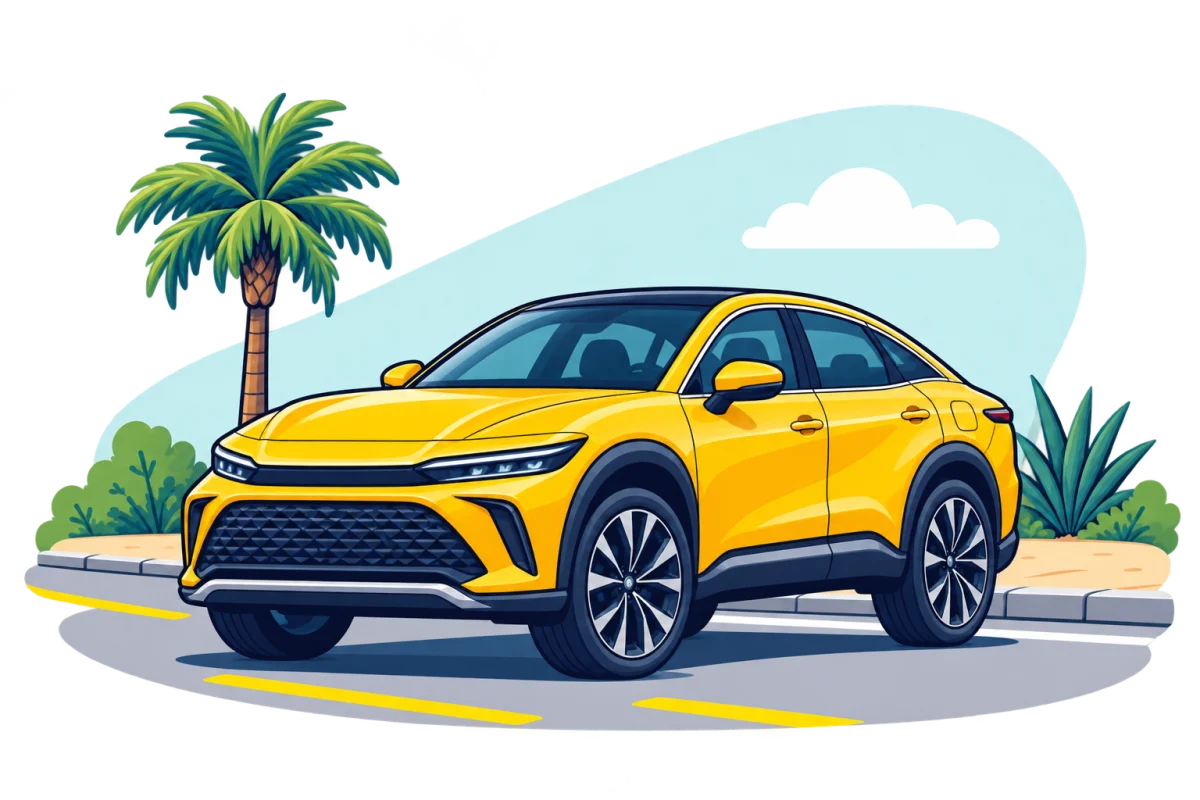 Toyota Crown Car Hybrid
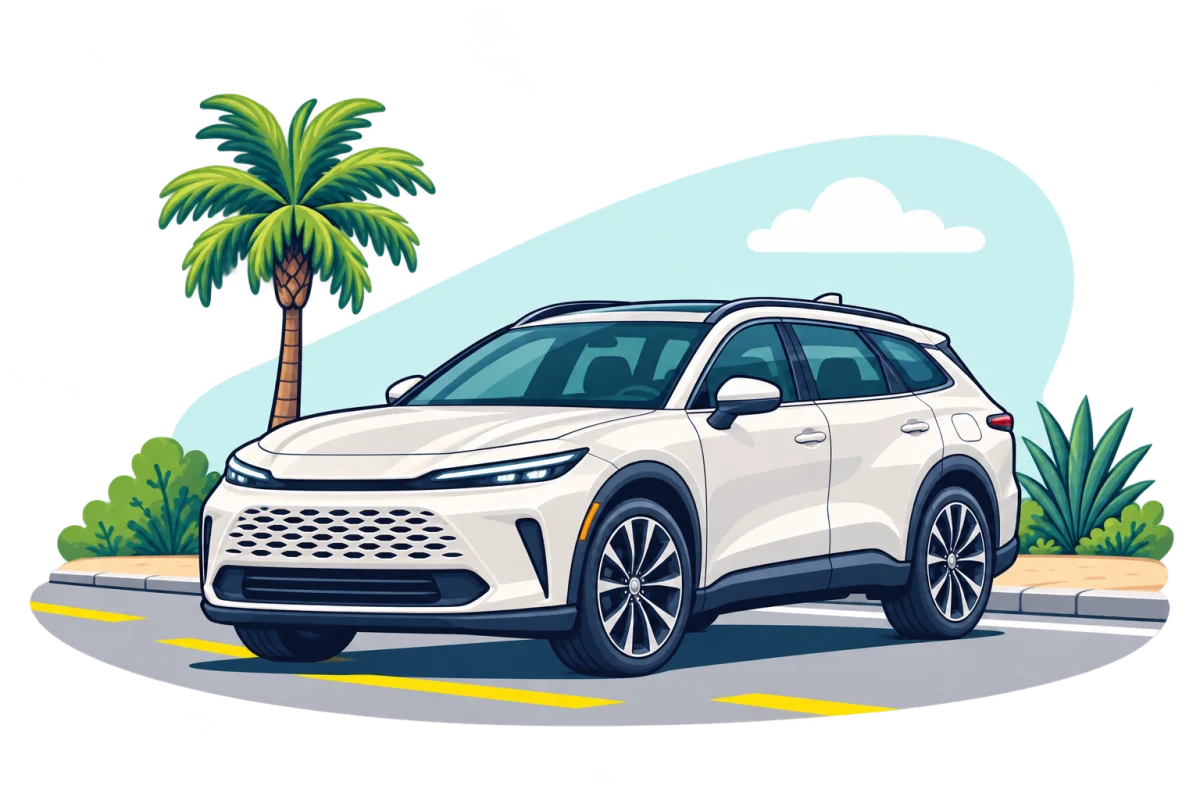 Toyota Crown Signia Wagon Hybrid
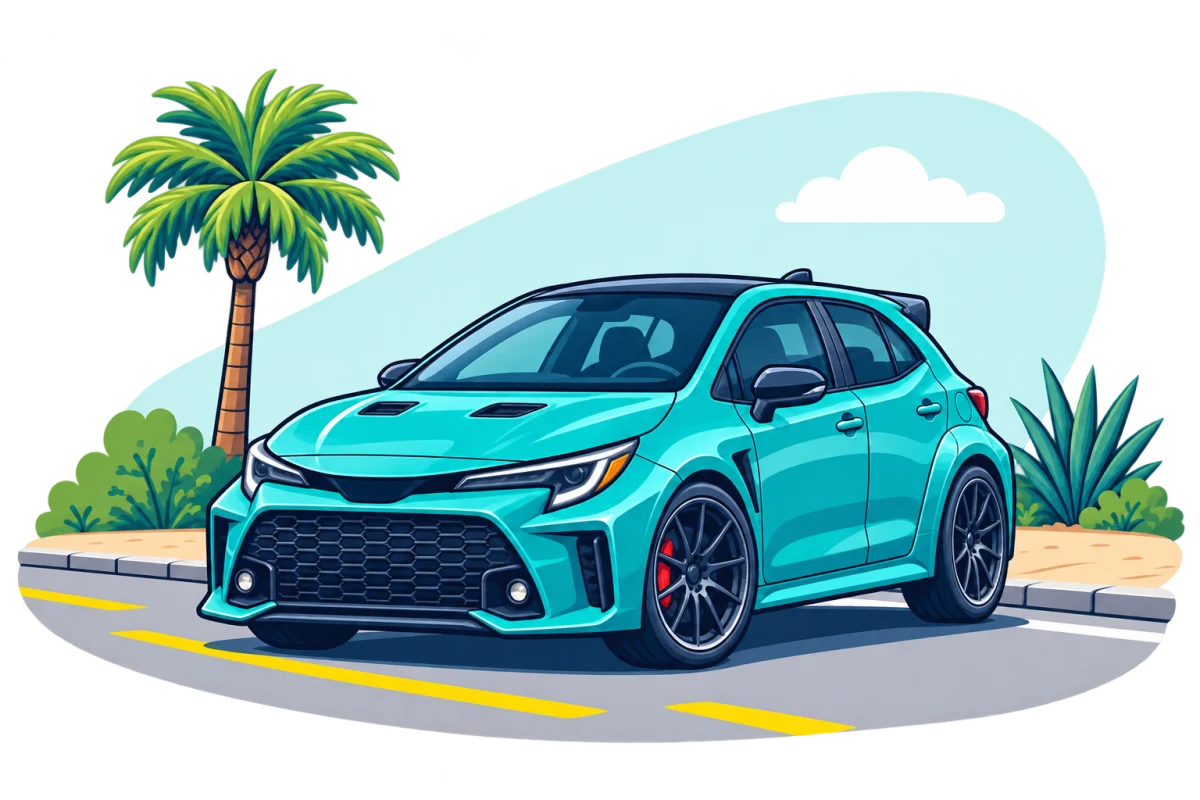 Toyota GR Corolla Car Gas
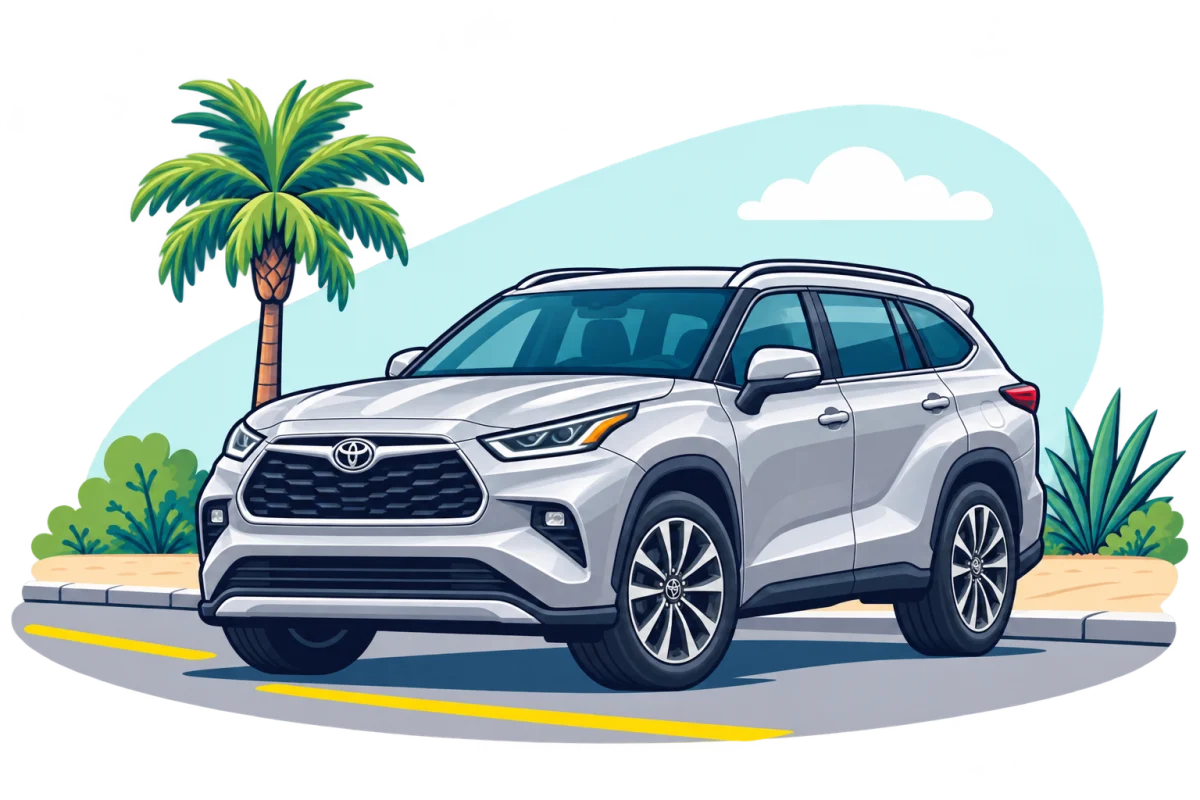 Toyota Highlander SUV Gas, Hybrid
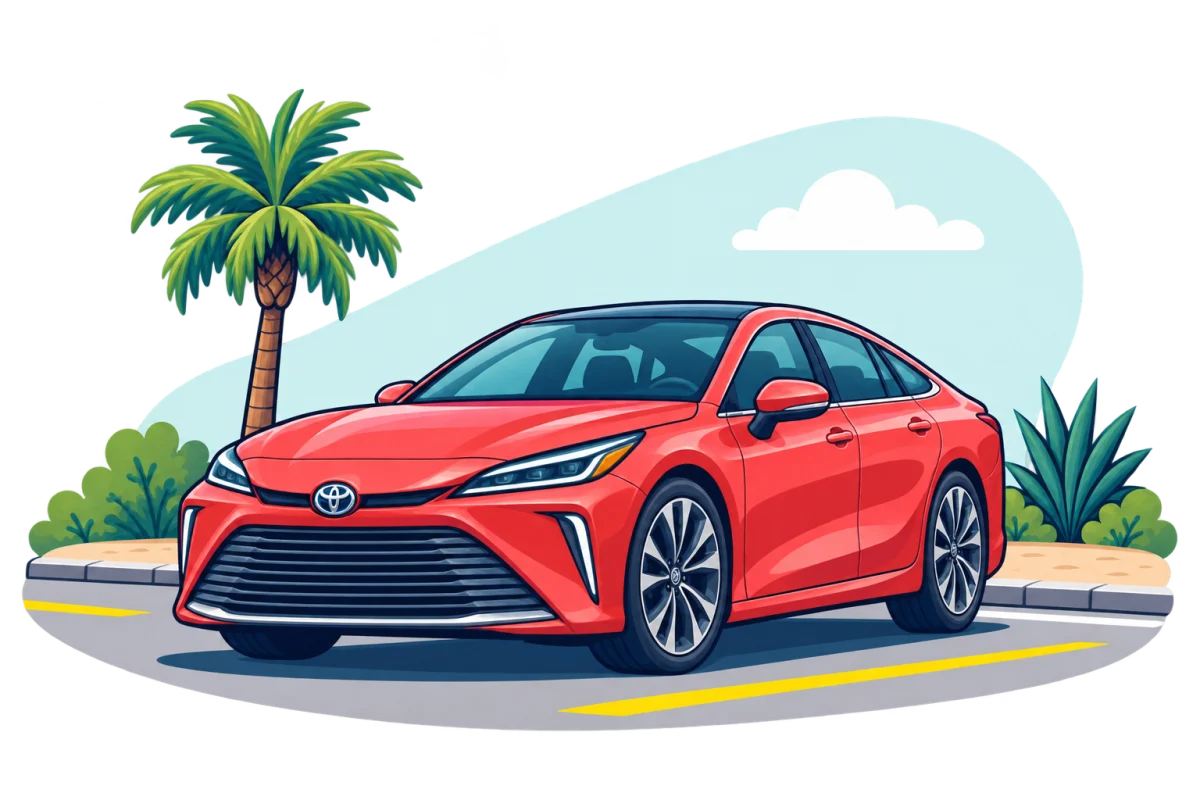 Toyota Mirai Car Fuel cell
By county: Mirai
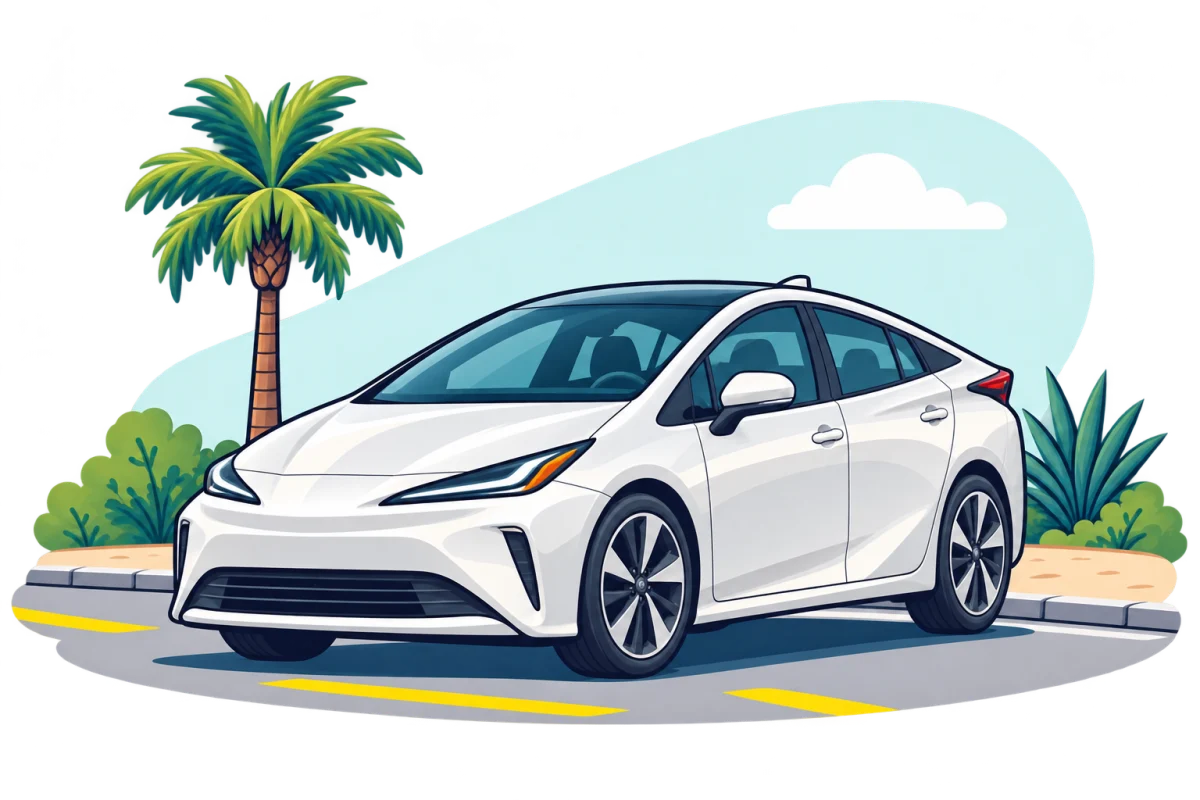 Toyota Prius Car Hybrid
By county: Prius Prime, Prius PHEV
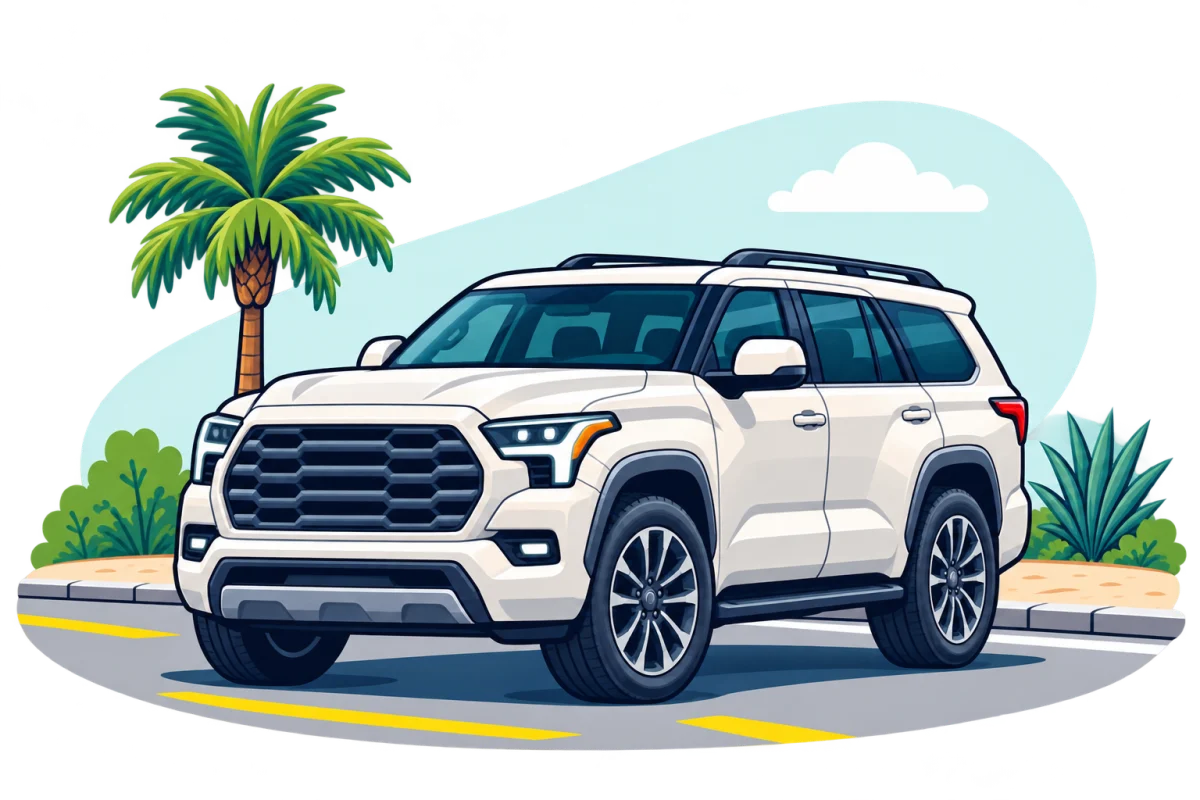 Toyota Sequoia SUV Hybrid
The model-year mix
A closer look at plug-in and fuel-cell models
141,587 Toyota plug-in and fuel-cell vehicles across California counties.
New-car registrations
Toyota in California's new light-vehicle market, including fleets.
- Year to date
- 252,635 +5.1% vs 240,266 a year earlier, revised
- Latest quarter
- 88,298 +14.3% year over year
U.S. rated models and configurations
216 models, 2,645 U.S. rated configurations, 1984–2027. Browse fuel economy, powertrain, range and U.S. specifications.